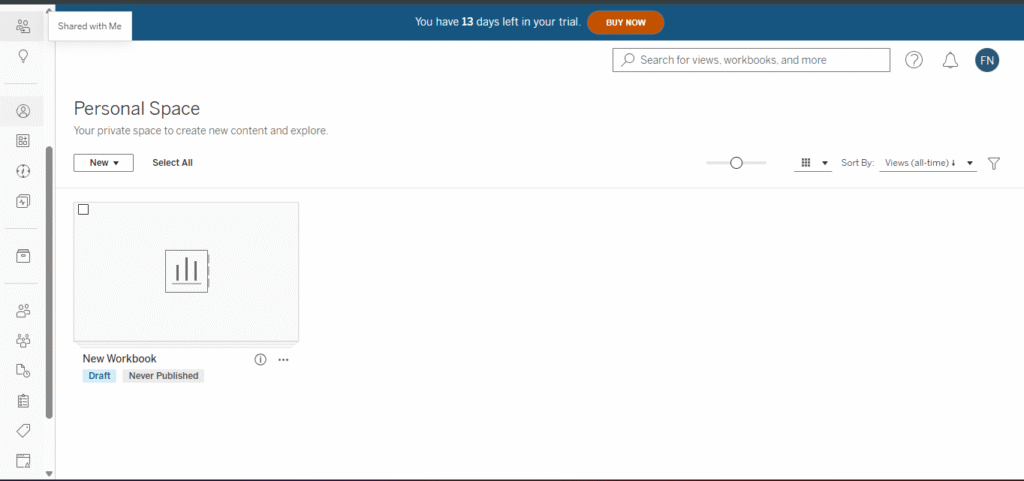
Tableau is a powerful AI data visualization tool that helps you to turn raw data into easy-to-understand charts and dashboards. It lets you explore, analyze, and share insights without the need to write complex code.
This blog post answers 15 common Tableau questions from adding filters and formatting labels to understanding costs and using calculated fields.
Let’s explore some practical, clear solutions that help you to use Tableau more confidently.

1. How to Select a Source File from a Published Tableau Dashboard
To connect a published Tableau dashboard to a new source:
- Go to Tableau Server or Tableau Online.
- Find the data source under “Explore”.
- Click “Connect” or “Create Workbook” to use it.
- You can also replace a data source in Desktop by going to Data > Replace Data Source.
✅ This keeps your workbook linked to a live source without uploading new files.
2. How Much Is Tableau?
Here’s the current pricing (2025 update):
| License Type | Cost (Monthly/User) | Features |
|---|---|---|
| Public | Free | Public dashboards only |
| Viewer | $15 | View and interact |
| Explorer | $42 | Analyze and share |
| Creator | $70 | Full functionality |
Choose what fits your role, analysts usually need Creator, while managers might use Viewer.
3. How to Edit Labels Independently in Tableau
Want to show only a few labels or customize their text?
- Use the Label shelf and uncheck “Show mark labels” globally.
- Drag the exact label field to the label area.
- You can format font, size, color—all independently.
💡Tip: Use calculated fields to add context like “Sales: $” or units.
4. How to Get Labels Inside a Pie Chart in Tableau
- Click your pie chart.
- Go to Label and check “Show mark labels.”
- Drag the field (like % of Total or Category) into the Label shelf.
- Use Label > Alignment > Middle Center to place it inside.
5. How to Add a Filter to a Text Object in Tableau
Text objects don’t allow filters directly but here’s a workaround:
- Create a parameter or sheet that acts as a filter.
- Use Dashboard > Actions and choose “Filter.”
- Trigger the action using your text or a shape that looks like text.
6. How to Add a Triangle Percent Change Icon in Tableau
- Create a calculated field:
IF [Change] > 0 THEN "▲" ELSE "▼" - Add this to the label or tooltip.
- Format using color for clarity green for up, red for down.
7. How to Share Tableau File Without Data
To share structure without sensitive data:
- Save your workbook as
.twb(not.twbx). - Or, remove data sources before saving:
- Go to Data > Remove and clear extracts.
- Send just the template to teammates.
8. How to Change a Field Based on Another in Tableau
Use calculated fields:
IF [Region] = "West" THEN [Sales]*1.1
ELSE [Sales]
This way, you control one field’s behavior based on another.
9. How to Create a Calculated Field in Tableau
- Right-click in the data pane > Create Calculated Field.
- Example:
Profit Margin = [Profit] / [Sales]
This new field becomes available like any other dimension or measure.
10. How to Format a Date When Concatenated to a String in Tableau
- Use:
"Report for " + STR(DATENAME('month', [Order Date])) + " " + STR(YEAR([Order Date]))
This makes your labels or tooltips more readable.
11. How to Make a Sheet a Filter in Tableau
- Create two sheets: e.g., Bar Chart and Map.
- On dashboard, go to Dashboard > Actions > Add Filter.
- Set source sheet to your filter sheet.
- Result: Clicking one sheet filters the other.
12. How to Remove Null Rows in Tableau
Quick options:
- Drag a filter for the field you want to clean → uncheck “Null”.
- Or, use this calculated field: tableauCopyEdit
IF ISNULL([Value]) THEN NULL ELSE [Value]
13. Can You Use Tableau for Asset Mapping?
Yes! Tableau supports spatial files, shapefiles, and GeoJSON.
- You can map assets like stores, equipment, or field offices.
- Add latitude and longitude fields and drag them into a map view.
14. What Is a Crosstab in Tableau?
A crosstab is a table format—like a spreadsheet view.
- Go to Show Me > Crosstab.
- Best for exact values, audits, or printing.
15. How Long Does It Take to Learn Tableau?
Here’s a basic timeline:
| Skill Level | Time Estimate |
|---|---|
| Beginner basics | 1–2 weeks |
| Dashboard building | 3–4 weeks |
| Advanced features | 2–3 months |
💡 Learning tip: Practice with public datasets and challenges.
Final Thoughts
Tableau is powerful but like any tool, it can feel overwhelming at first. These answers will help you take control of your dashboards and become a more confident data storyteller.
Want more tips?
👉 Subscribe for weekly tutorials and visual hacks.
👉 Share this guide with your data team!

Stay ahead of the curve with the latest insights, tips, and trends in AI, technology, and innovation.

